In a previous article I explained how to install telegraf on OPNSense so that you can collect several metrics from the box into your influxdb. In my case, since OPNSense is my DHCP, DNS and VPN server I really want to know if something happened to it and when.
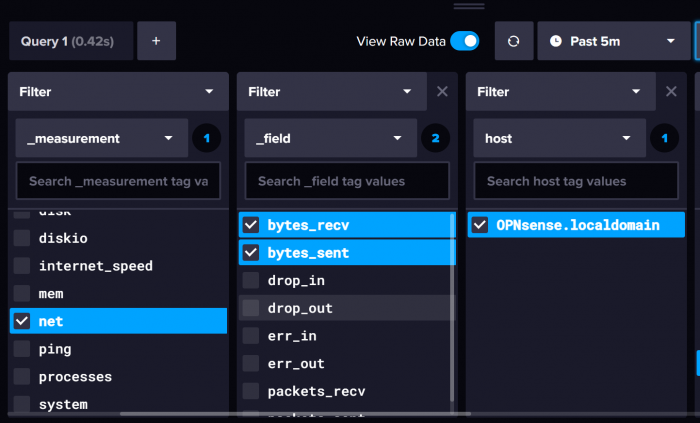
Since I could not really use telegraf to monitor my wireguard connections because of this, I focused on getting metrics from the wireguard interfaces themselves. If the VPN was down there would be no traffic on those interfaces. In order to collect network metrics, you need to go to OPNSense –> Services –> Telegraf –> Input and check the Network checkbox as this is not enabled by default. Once you do that you see the following in influxdb
Of course, bytes_recv and bytes_sent are valuable metrics on their own but I also want to calculate their rate of change, namely bytes/second. Since influxdb is a timeseries database this is very easy to do arithmetically.
Let’s focus on just two values from the database:
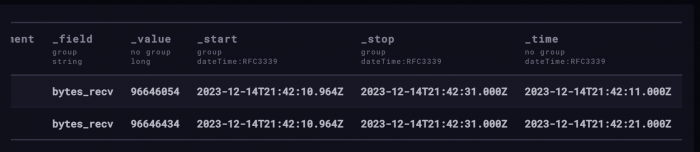
Based on the above the rate of change would be
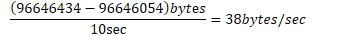
I am sure we can just calculate the rate of change using this formula in flux but what if there was an easier way ?
Hello derivatives
I had to refresh my calculus since I haven’t dealt with derivatives since university. The idea of a derivative is exactly that, to calculate a rate of change. If you have a function y = f(x) the derivative dy/dx tells you how much y changes with a small change of x.
If y is location and x is time, the derivative will give you the velocity (change of location over time).
If y is velocity and x is time the derivative will give you the acceleration (change of velocity over time).
The derivatives and their mathematical operations are very important when it comes to gradient descent, an optimization method used in neural networks which is a domain that is highly popular nowadays.
Anyway, back to our task, bytes/sec can also be calculated by using the derivative function. This can easily be done in the Data Explorer of influxdb as follows
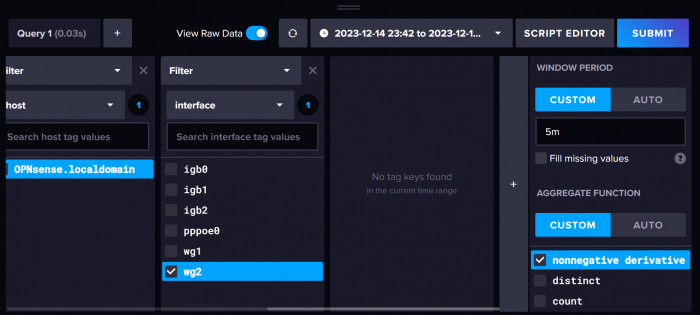
You just need to select the nonnegative derivative from the Aggregate Function panel above. Once you click Submit you get the following
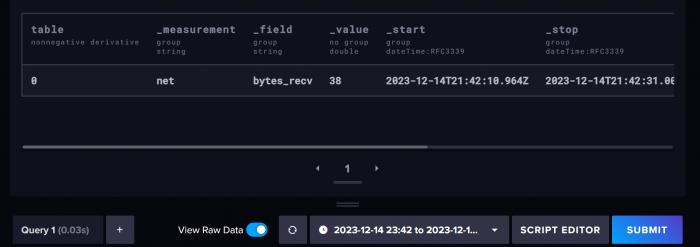
which matches are arithmetic calculations!
Note: Make sure you toggle the View Raw Data switch in order to see the numerical values instead of a diagram.
In general, when I am trying to figure things out, I try to experiment with very limited data instead of thousands of datapoints so that I can verify my config. I make a lot of mistakes all the time so I don’t trust myself!
If we click on the Script Editor button the query is created for us
from(bucket: "opnsense")
  |> range(start: v.timeRangeStart, stop: v.timeRangeStop)
  |> filter(fn: (r) => r["_measurement"] == "net")
  |> filter(fn: (r) => r["_field"] == "bytes_recv")
  |> filter(fn: (r) => r["host"] == "OPNsense.localdomain")
  |> filter(fn: (r) => r["interface"] == "wg2")
  |> derivative(unit: 1s, nonNegative: true)
  |> yield(name: "nonnegative derivative")
where
wg2 is the wireguard interface in OPNSense
opnsense is the bucket where all the data from OPNSense is stored.
I then use this query in Grafana to produce a gauge (for an instantaneous value) and also a time series graph where I can see the historical data.